
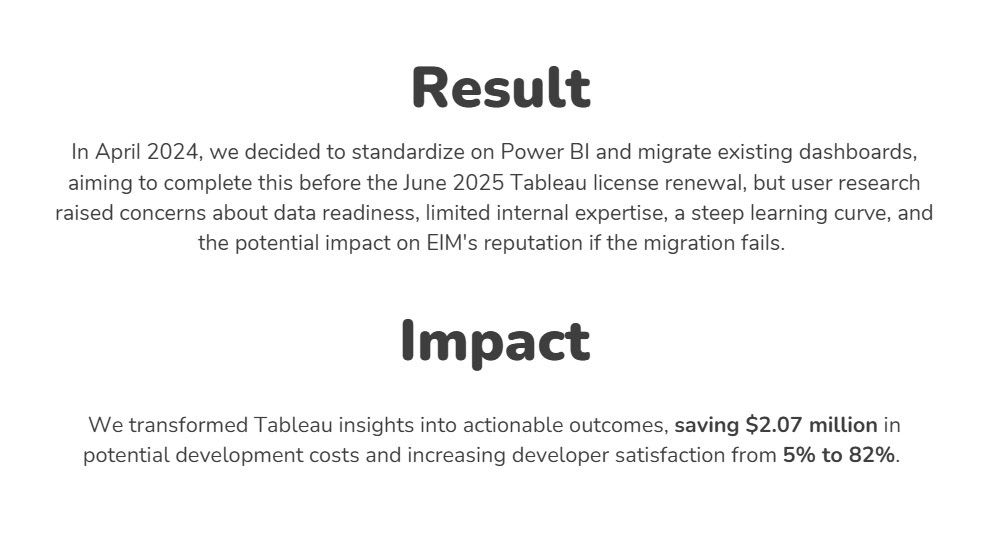
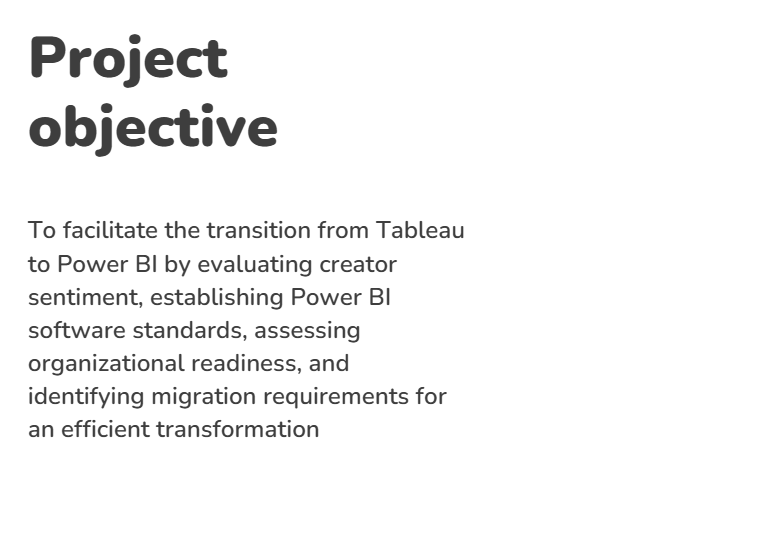
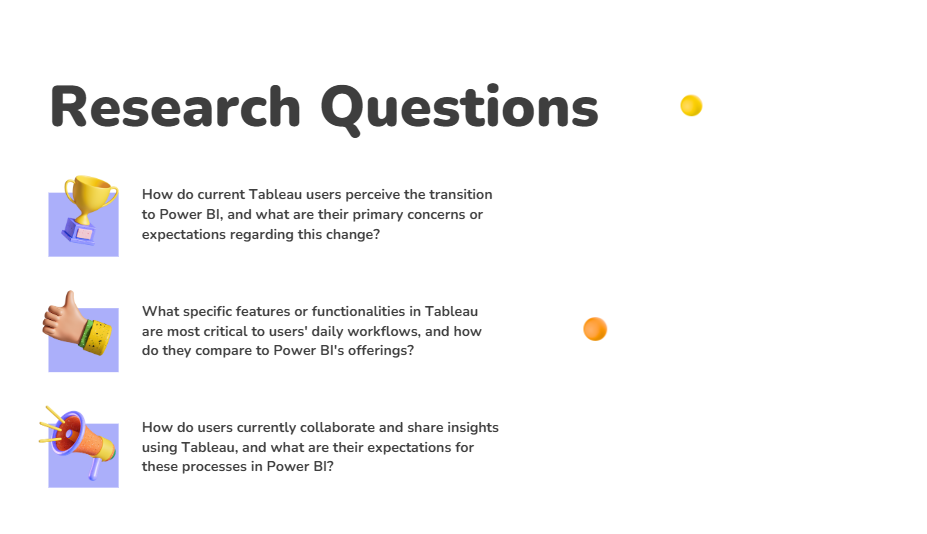
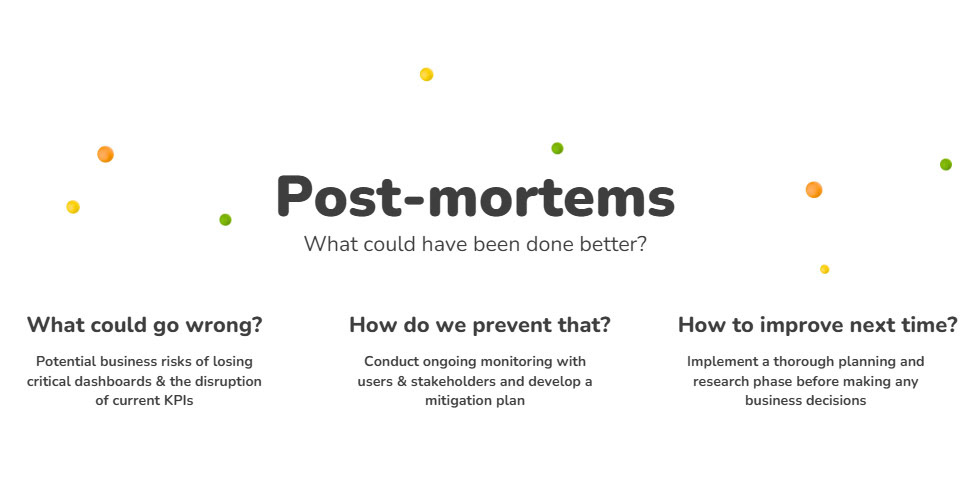
EDF leadership decided to switch from Tableau software to Power BI visualization tool due to Tableau's annual cost. However, this decision was made without conducting comprehensive research and analysis of several factors that could potentially cost the business more due to Power BI's lack of certain features.
This caused significant stress for EDF's Tableau developers, who were given only about one year to complete the migration.


I conducted market research and competitive analysis and discovered that Power BI supports over 250,000 organizations, including 97% of the Fortune 500 companies.​​​​​​​ However, just because Power BI benefits other companies does not mean it will also benefit EDF.


I approached this retrospective analysis by conducting in-depth interviews with key stakeholders to uncover the rationale behind the decision to switch from Tableau to Power BI. I gathered feedback from Tableau developers and end-users to assess the impact on their workflows and productivity. Additionally, I performed a feature comparison between Tableau and Power BI, focusing on critical needs specific to EDF, and conducted a cost-benefit analysis that considered licensing, training, migration, and potential productivity losses.​​​​​​​

I also evaluated the feasibility of the one-year migration timeline against industry standards and researched how other organizations managed similar transitions to identify best practices. 
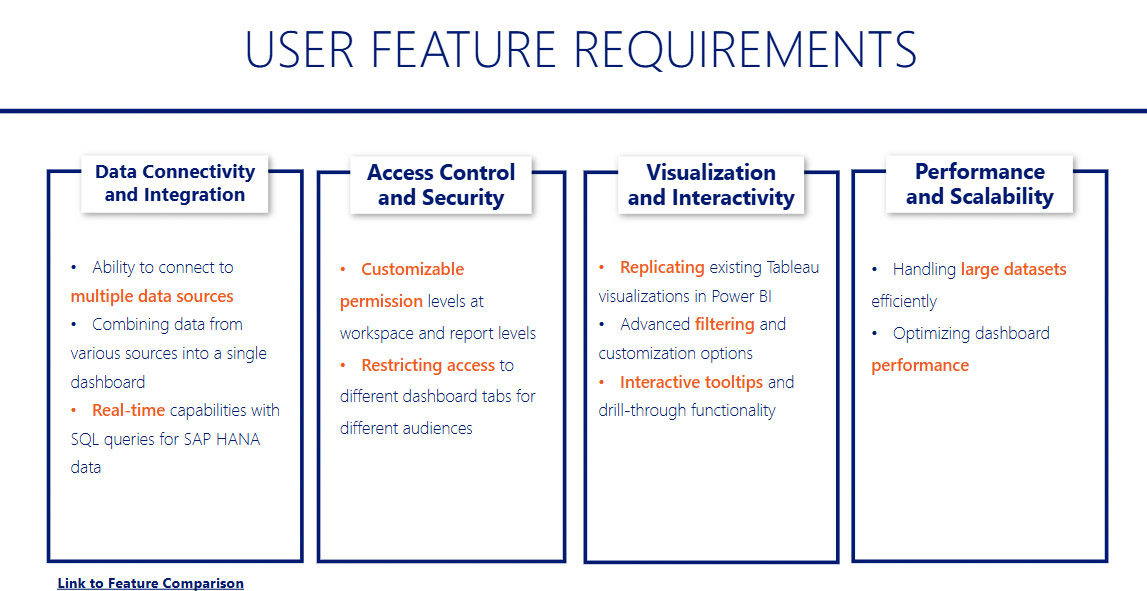
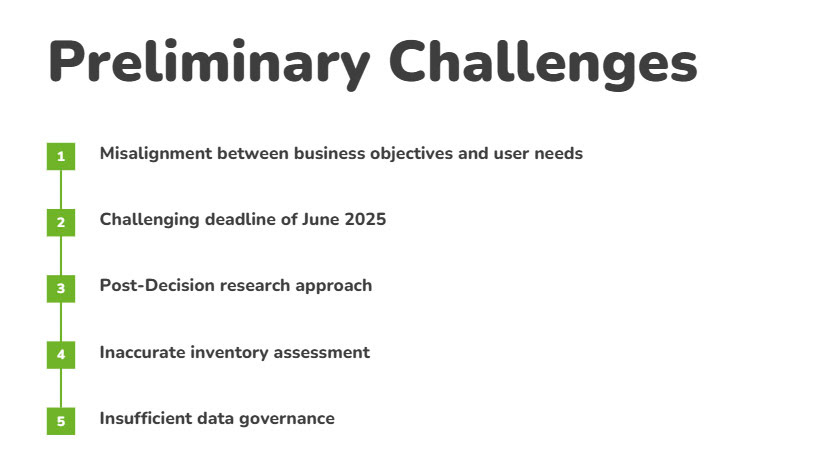
Through this process, I identified several preliminary challenges, including a lack of comprehensive pre-decision analysis, insufficient consideration of user needs, underestimation of migration complexity, inadequate communication strategies, and potential hidden costs. I shared these insights with stakeholders to facilitate a constructive discussion on improving future technology adoption strategies while addressing current challenges.


A critical challenge I communicated to stakeholders was the unrealistic timeline for the transition. After thorough analysis, I determined that several factors were not adequately considered in the initial plan. These included the lack of established data governance, the need for a comprehensive inventory of existing Tableau assets, and the time required for Tableau developers to learn Power BI and complete the migration. 
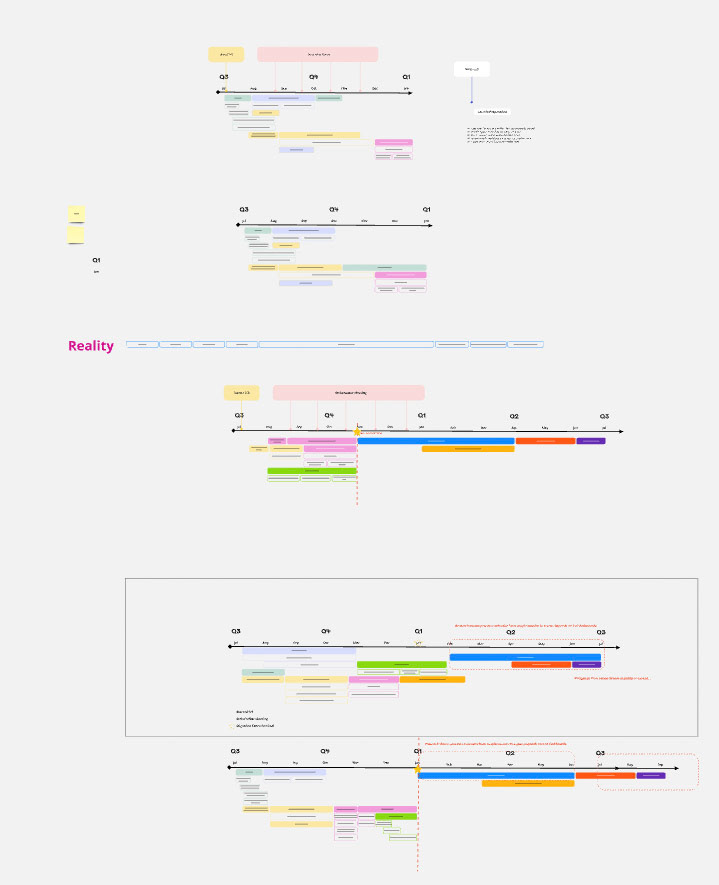
To address this, I iteratively revised the projected timeline, meticulously accounting for each potential variable and constraint. This revised timeline provided a more realistic and achievable roadmap for the transition, ensuring all critical factors were properly addressed.
​​​​​​​


Miro: brainstorming timeline
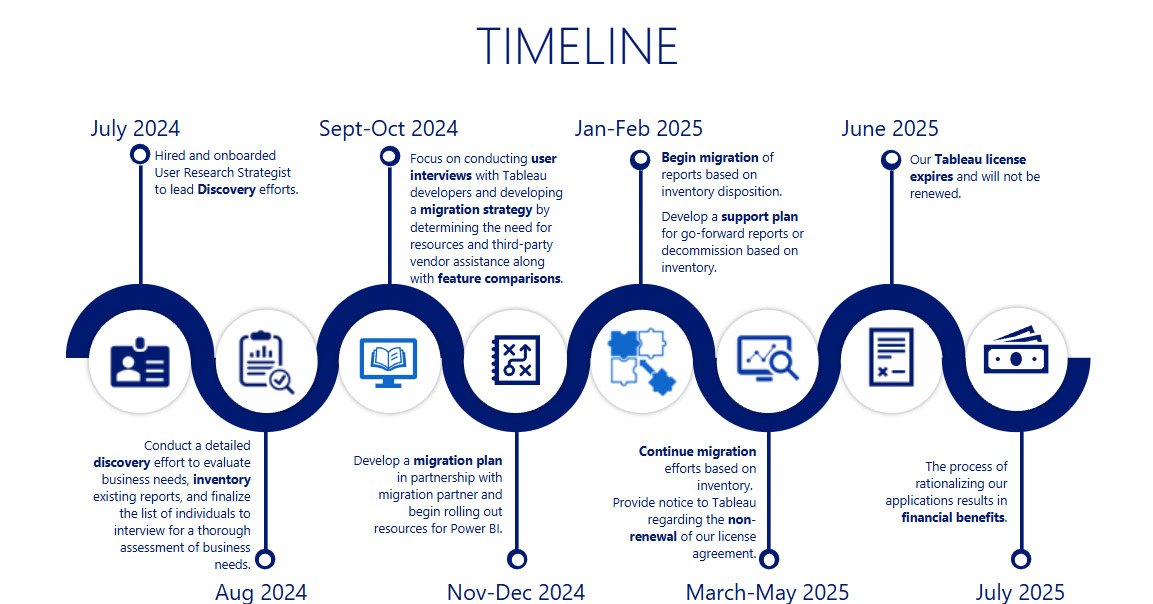
Finalized Timeline: I emphasized that this is only a projected timeline, and things may change as the research uncovers more insights



After consulting with over 50 stakeholders to understand the business objectives and goals, I designed a mixed-methods study. This included desk research, qualitative 1:1 in-depth interviews, and quantitative survey questionnaires. I then carefully selected a diverse sample of 17 participants across North America, comprising both Tableau developers and Power BI users, to ensure a comprehensive perspective on the software transition.​​​​​​​


Quantitative Method: Survey questionnaires were sent to users prior to the one-on-one interviews so that I could tailor my discussion guides accordingly for a more effective conversation
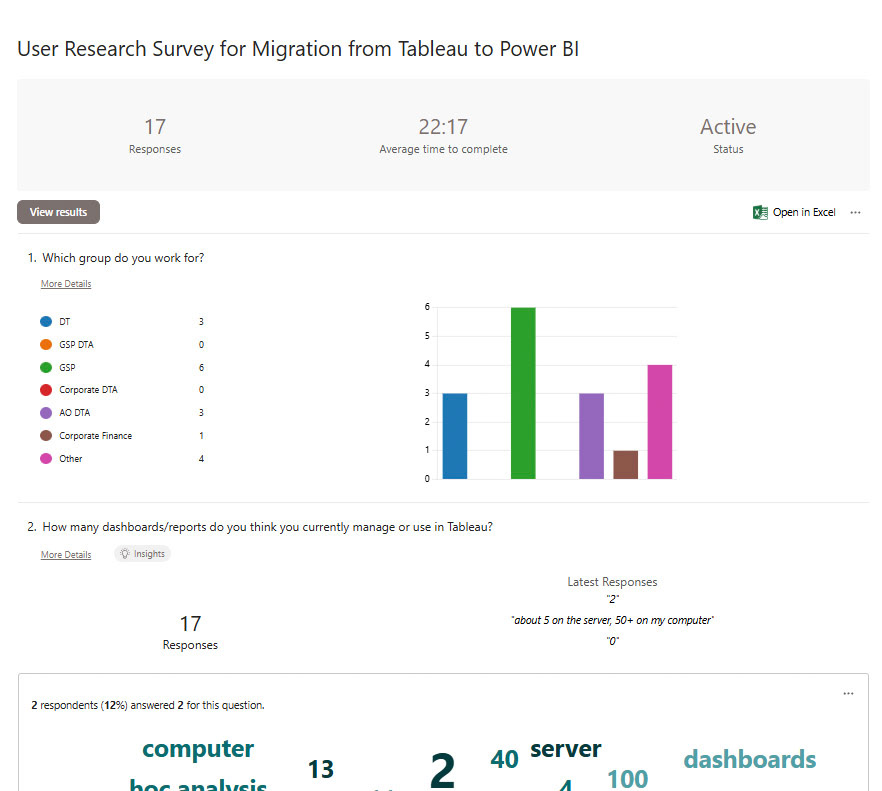
Survey Results
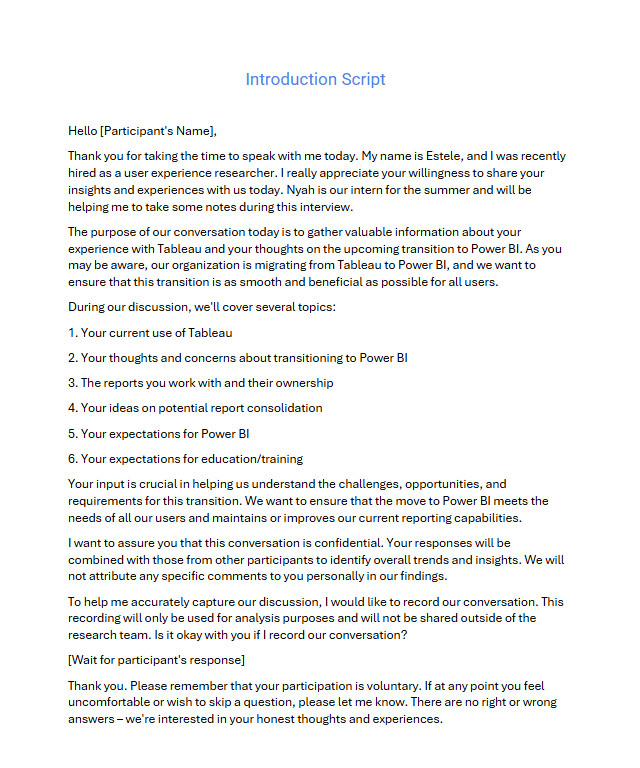
The discussion guide was carefully crafted to align with the project's business objectives and goals
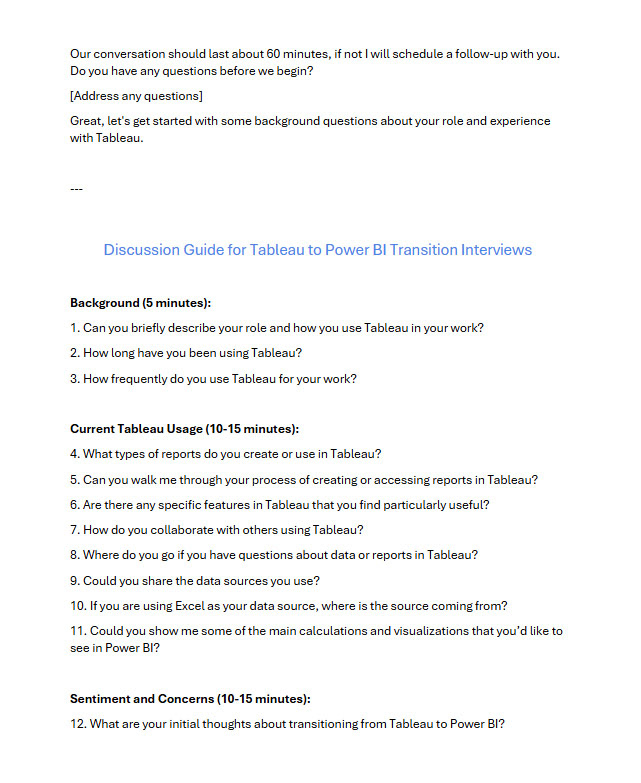
The discussion guide helps me ask deeper and follow-up questions naturally
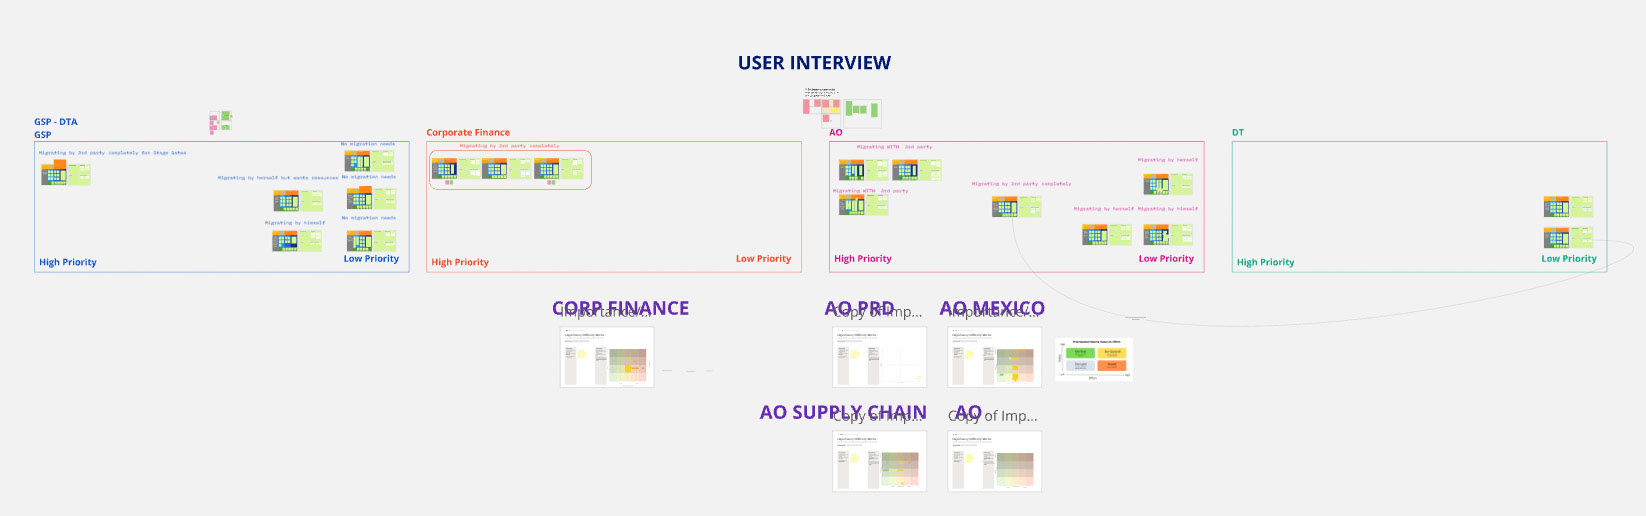


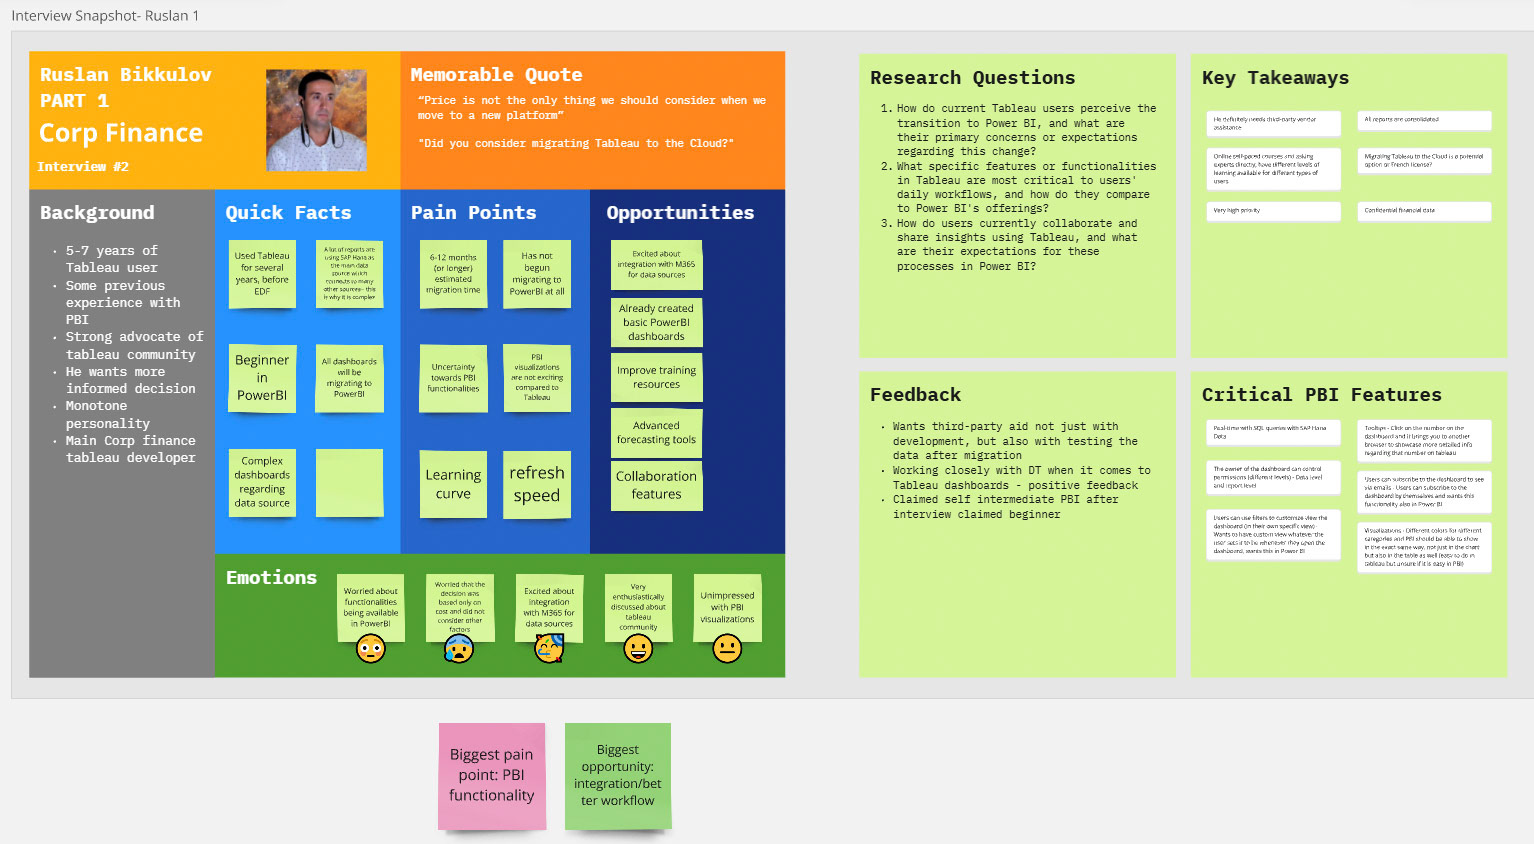
I created snapshots for all the interviews I conducted and organized the groups into GSP, AO, Corporate Finance, and DT, representing different business departments at EDF.​​​​​​​

Miro: Interview Snapshots


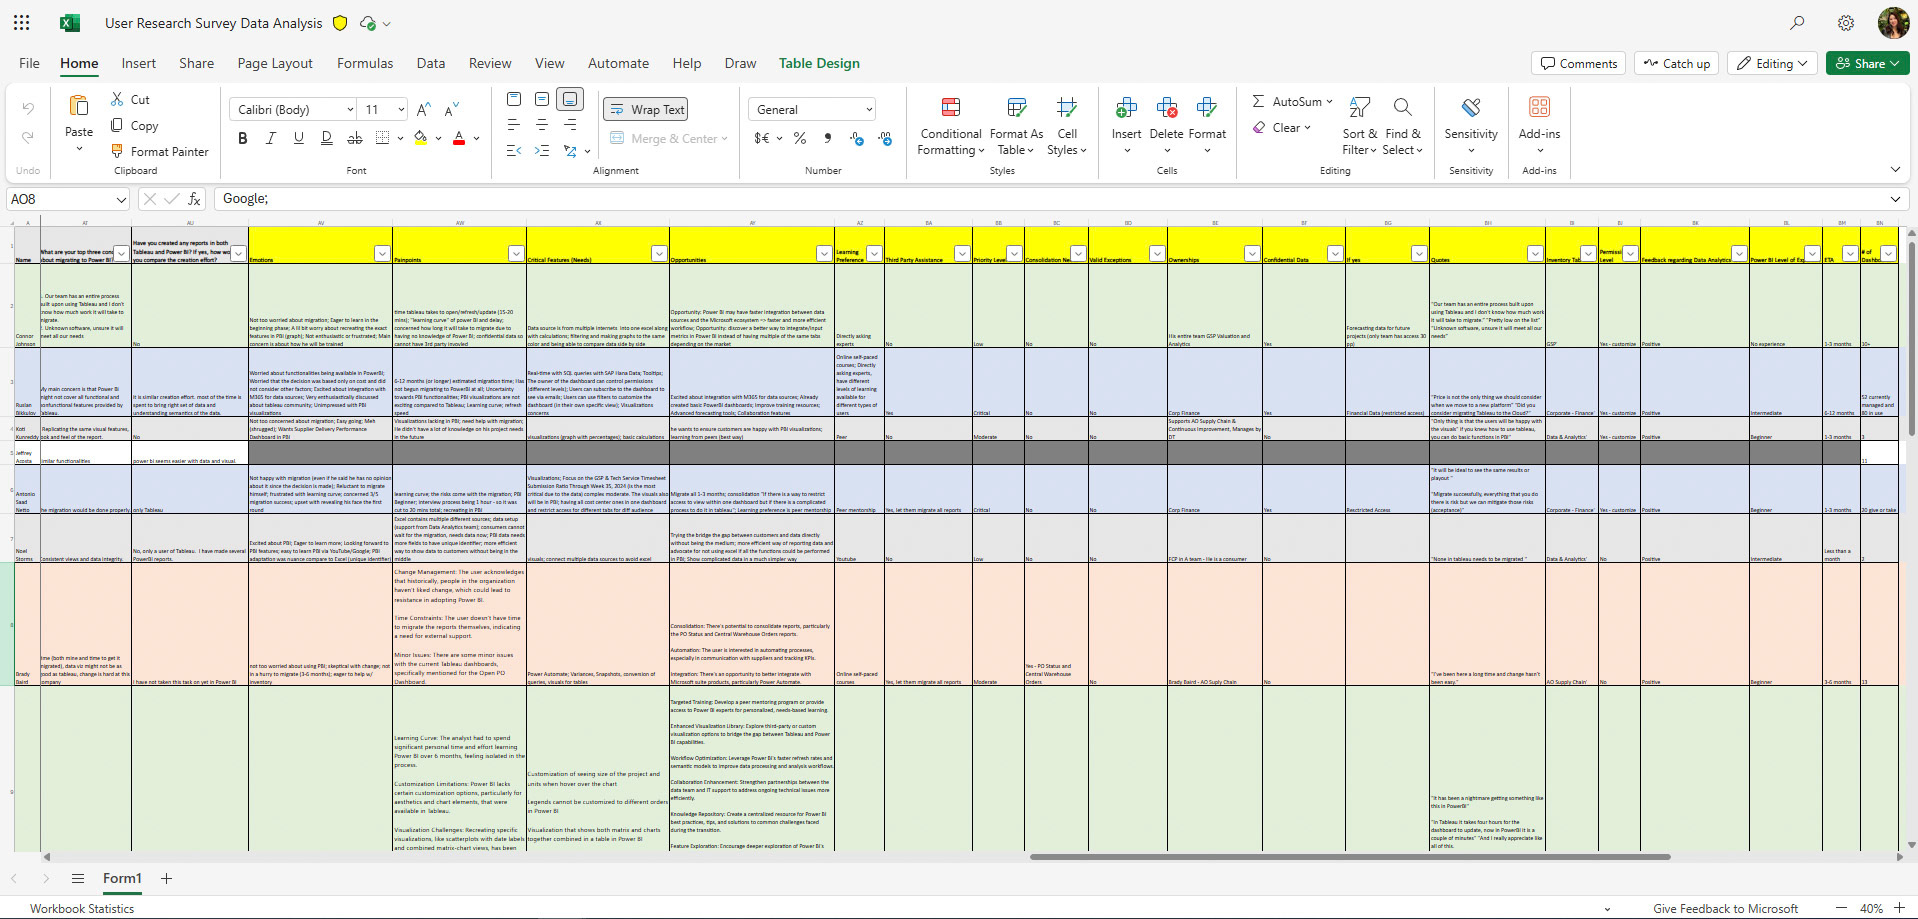
I conducted a comprehensive data analysis of all interviews, consolidating the information into a single Excel spreadsheet. This allowed me to identify recurring patterns and themes across participants. I then implemented a color-coding system to highlight overlapping values, pain points, needs, wants, and opportunities. This visual approach facilitated a more efficient identification of key insights and trends across different departments and user groups.

User Research Data Analysis Spreadsheet
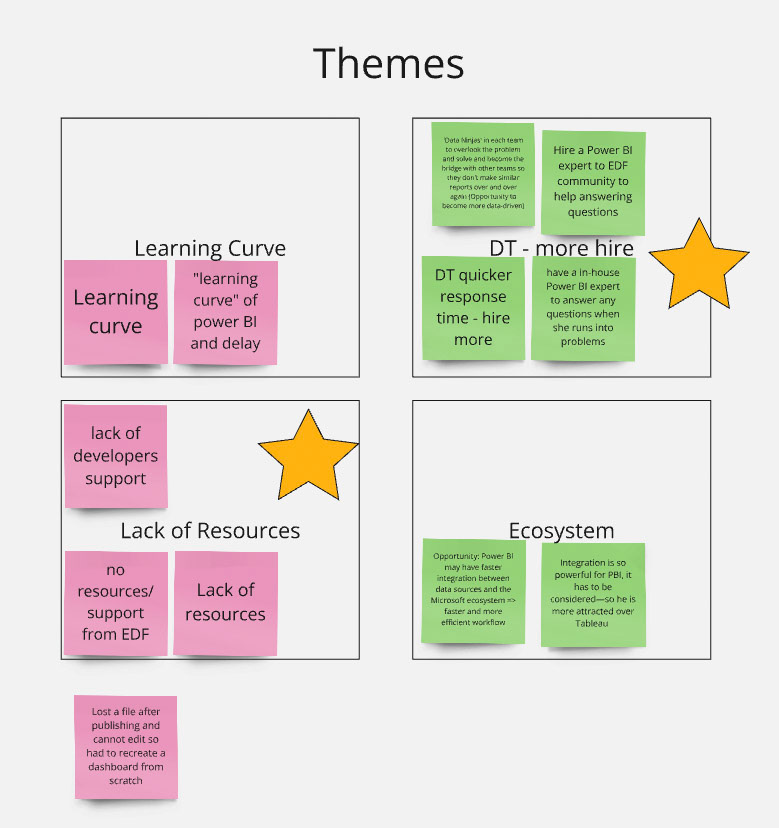
Themes/Patterns from interviews
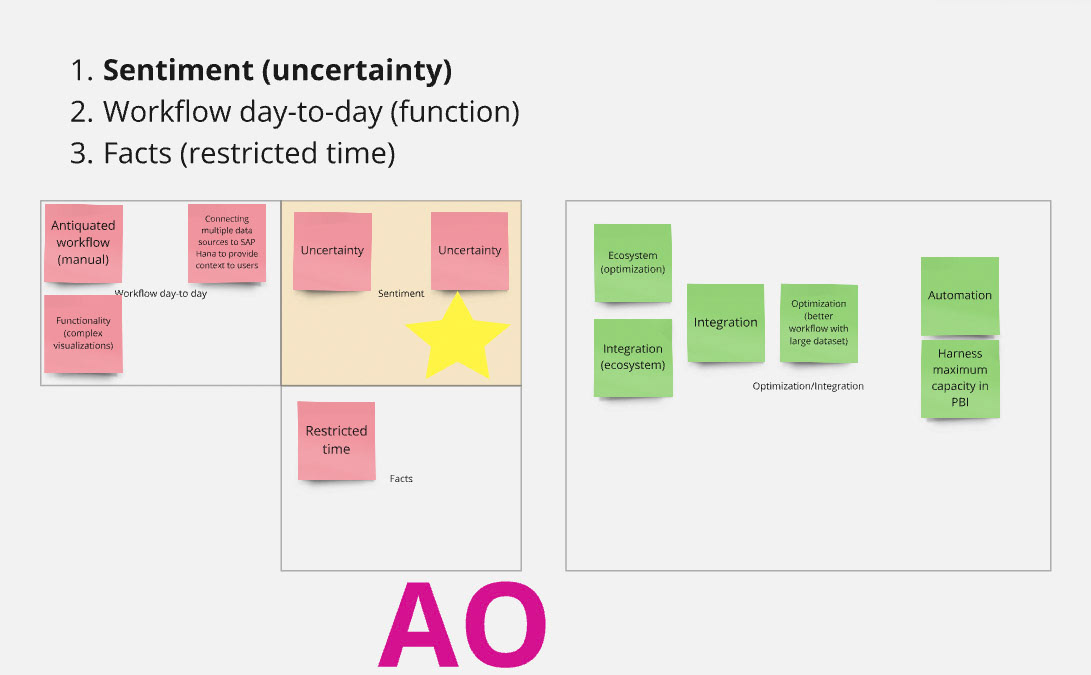
Different groups had different values according to their business objectives


I coordinated comprehensive meetings with all Tableau developers to compile a detailed EDF inventory across all departments. 
- Number of users and their identities
- Dashboard view counts for the past quarter
- Data size and source locations
- Dashboard ownership information
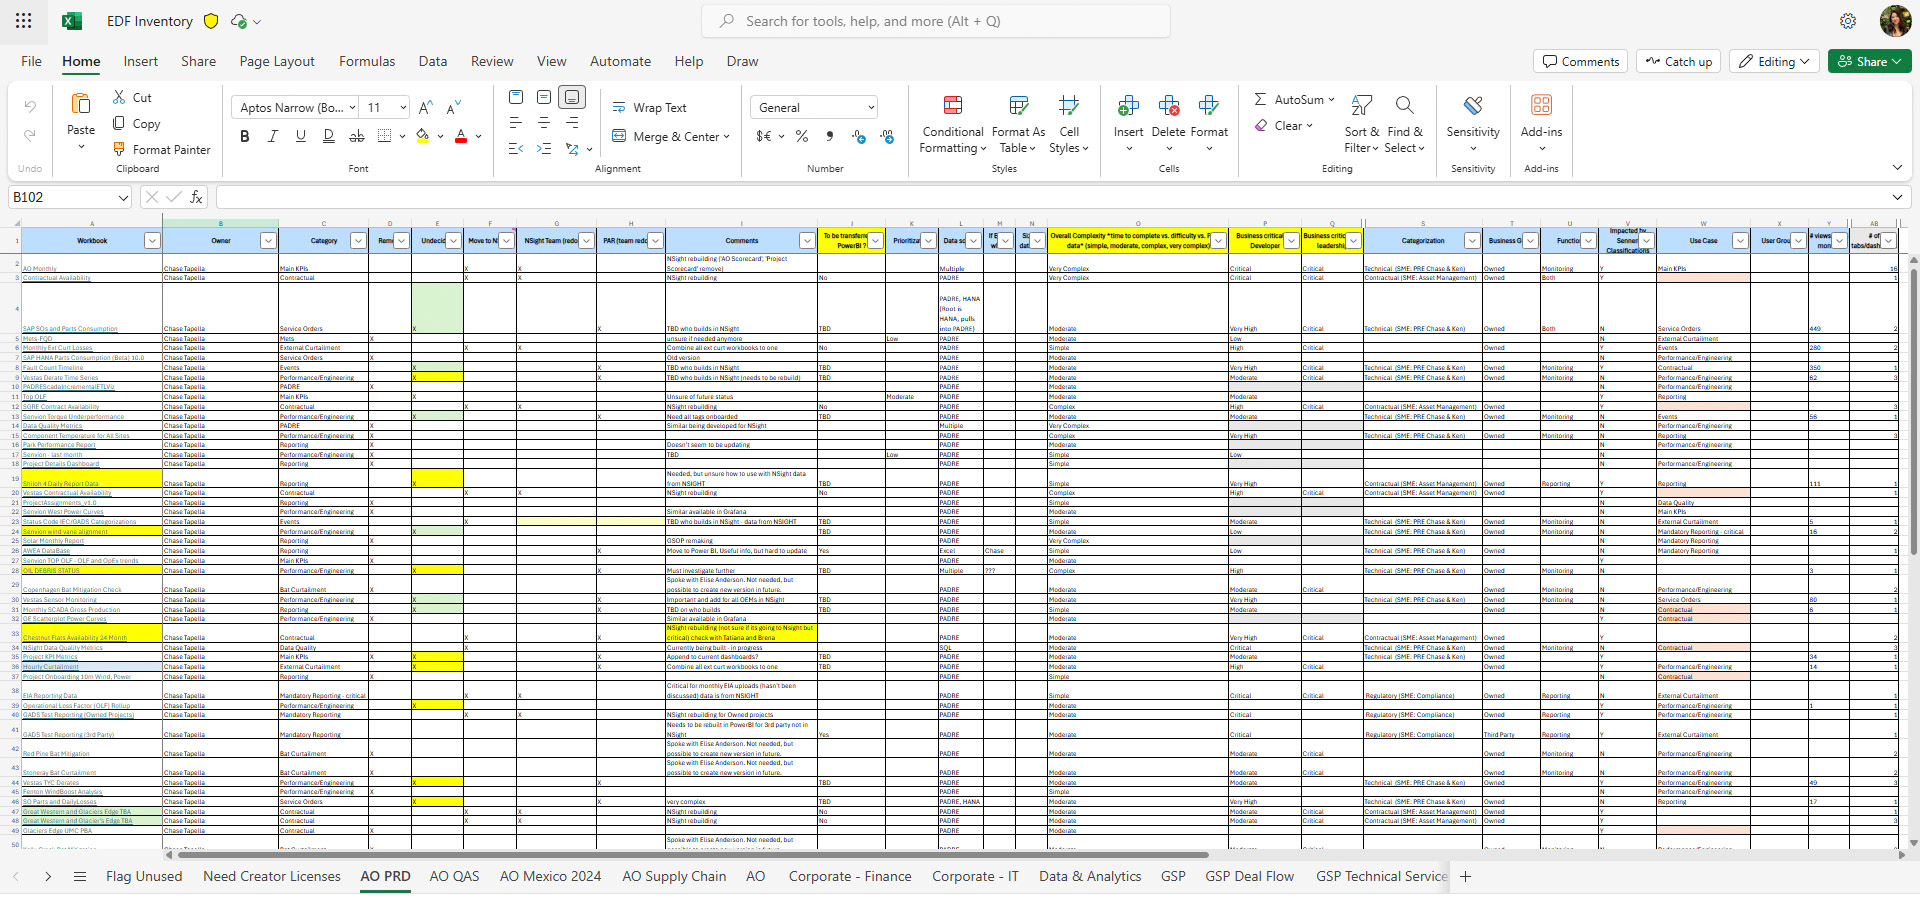

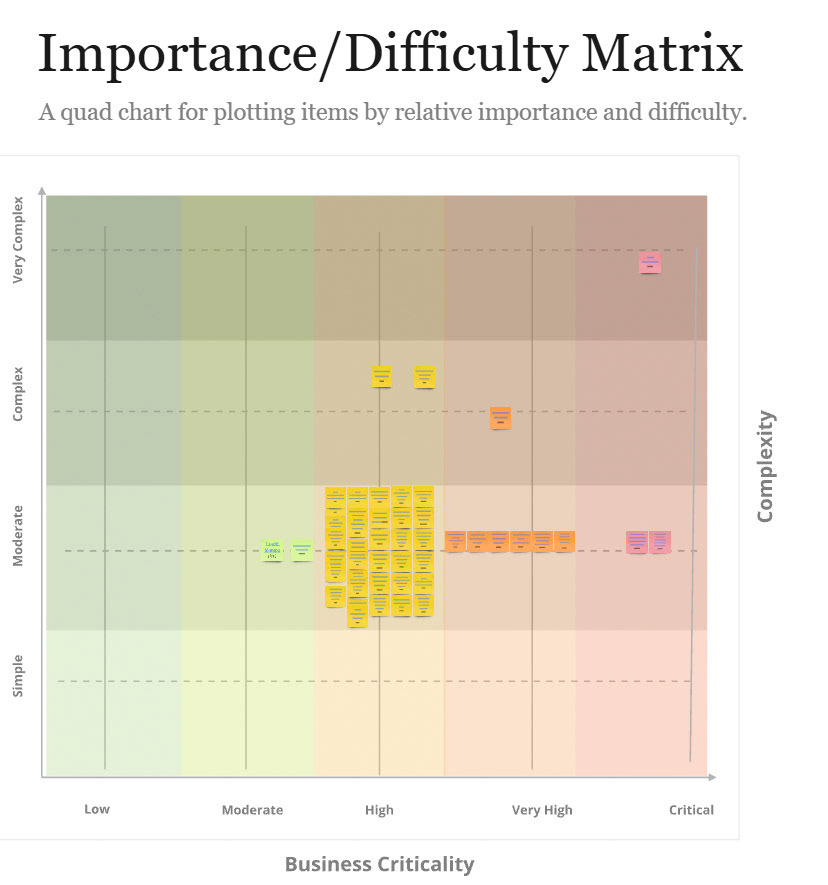
Following this, I conducted a thorough prioritization analysis of the inventory. 
1. Business criticality
The importance and impact of the report on business operations

2. Technical complexity
The intricacy of queries and processes involved in creating the dashboard and connecting to various data sources

This prioritization enabled us to identify which reports were most crucial for immediate migration and which could be addressed later in the transition process, ensuring a strategic and efficient approach to the Power BI migration.


EDF Inventory

Prioritization Metrics
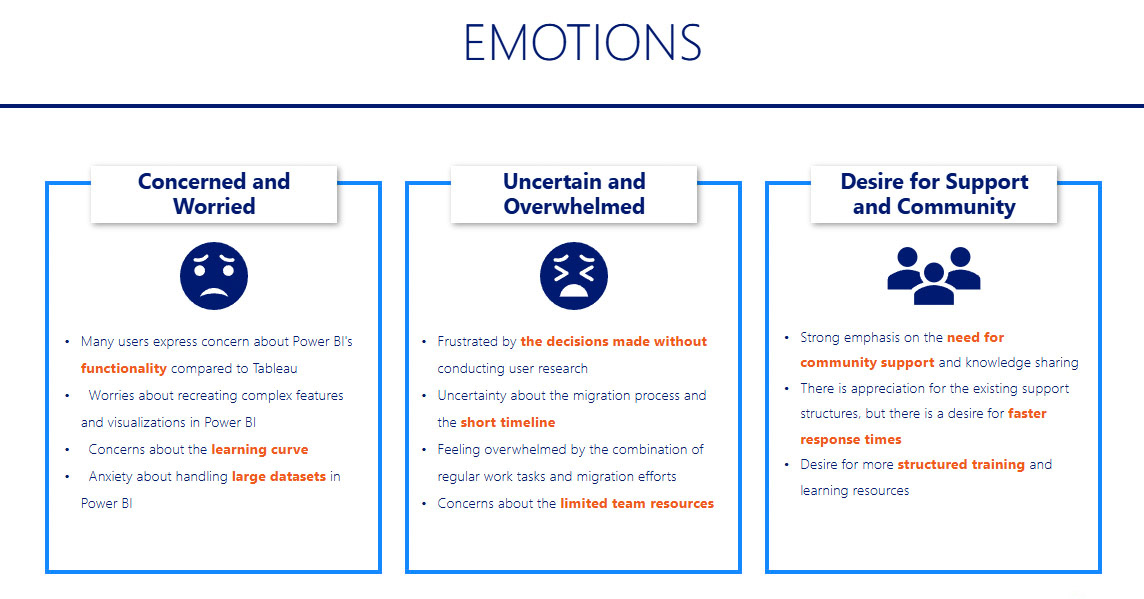


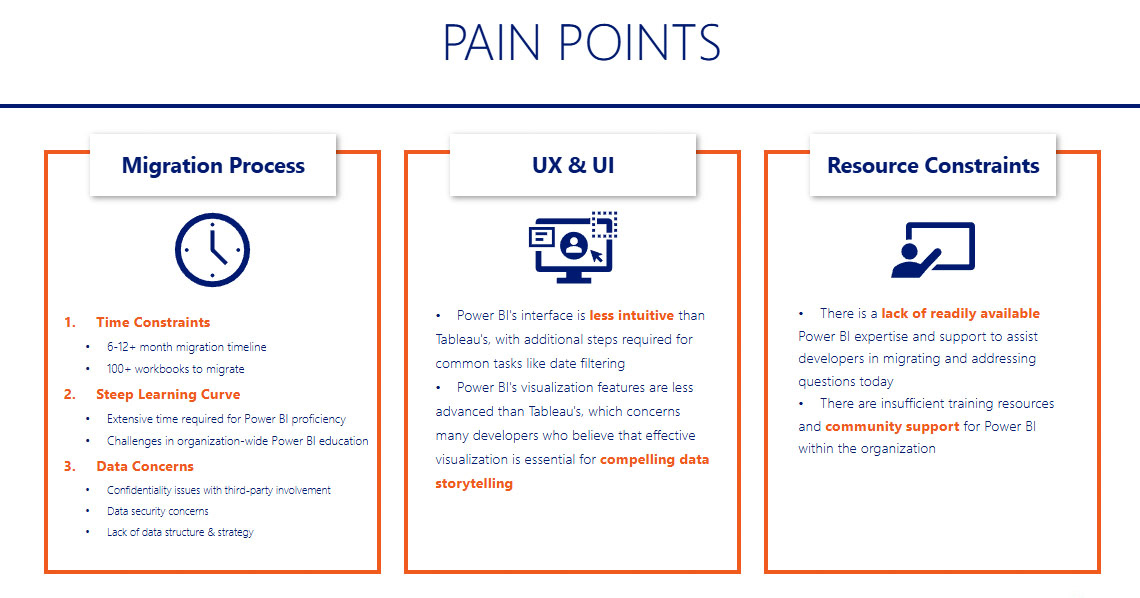
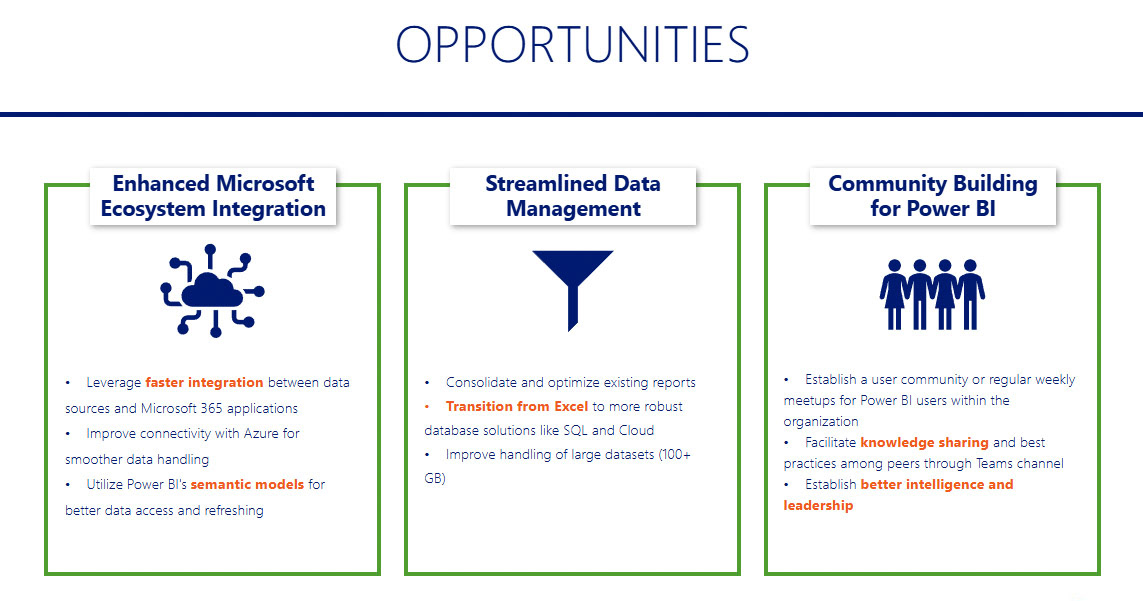
The research findings included current roadblocks, a risk analysis, and users' learning preferences, including whether they require third-party vendor assistance. Additionally, the findings addressed users' emotions, pain points, needs, wants, and opportunities.


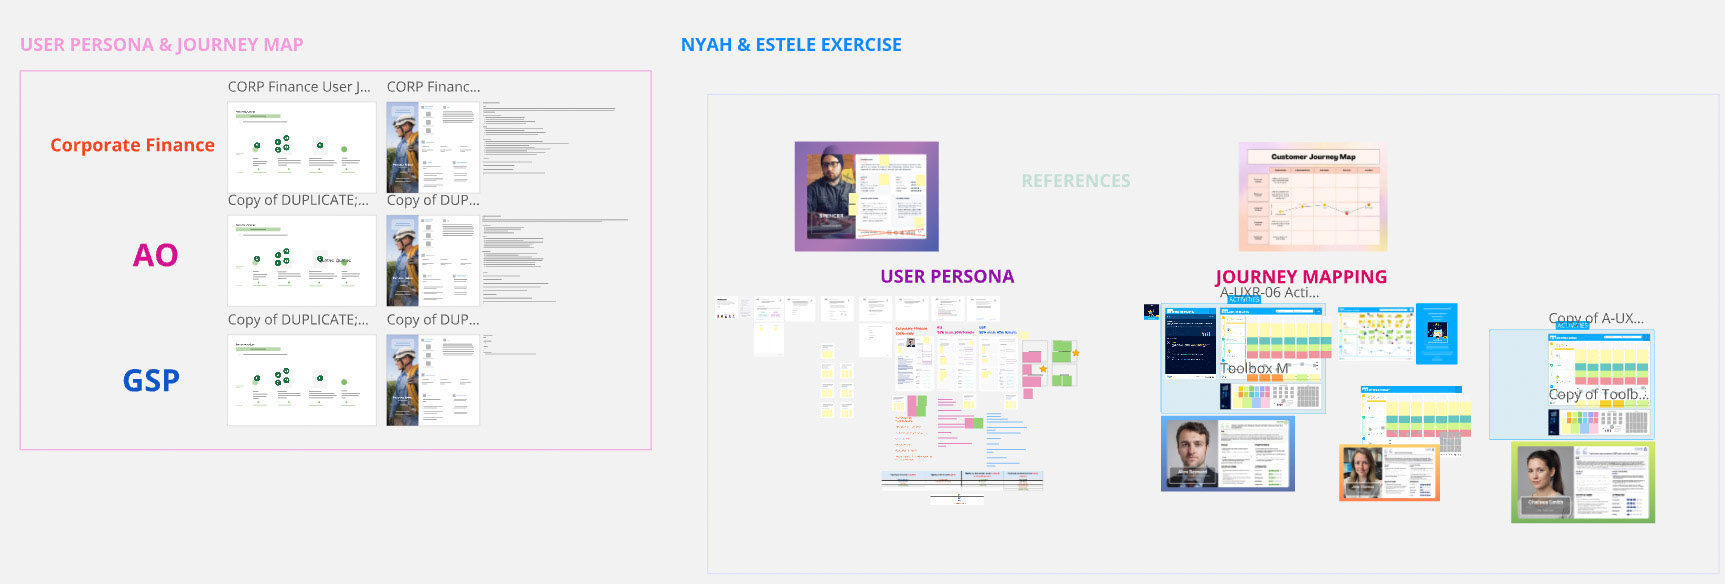
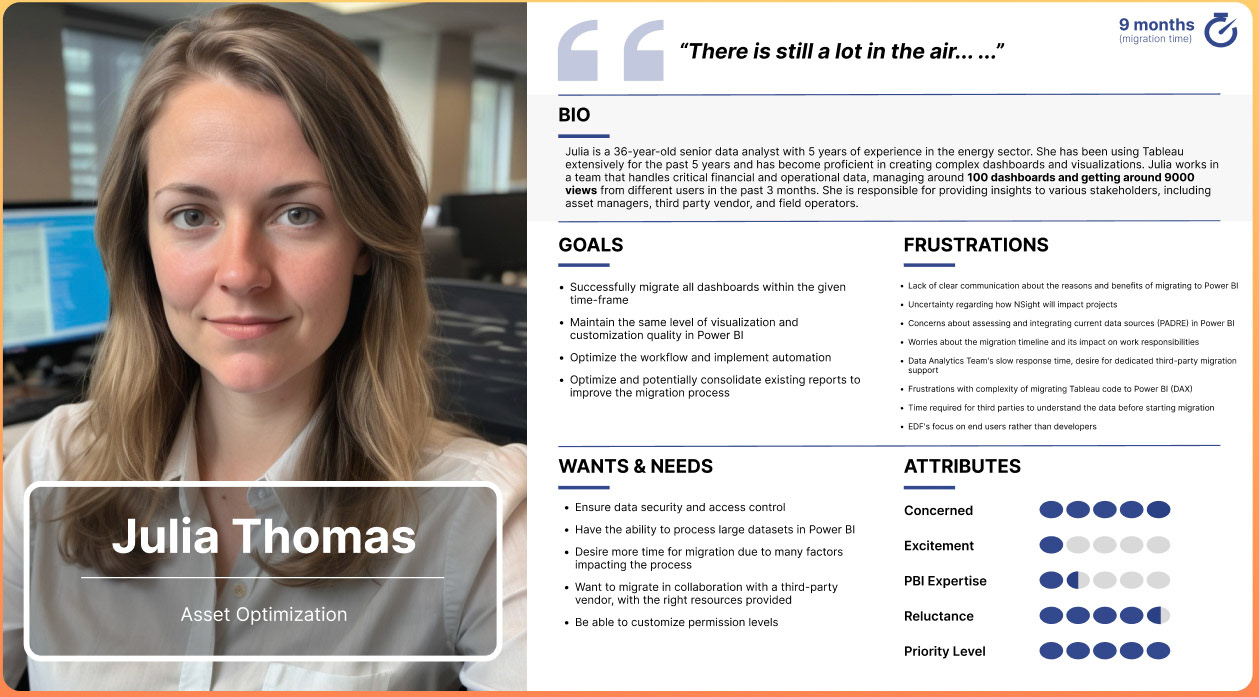
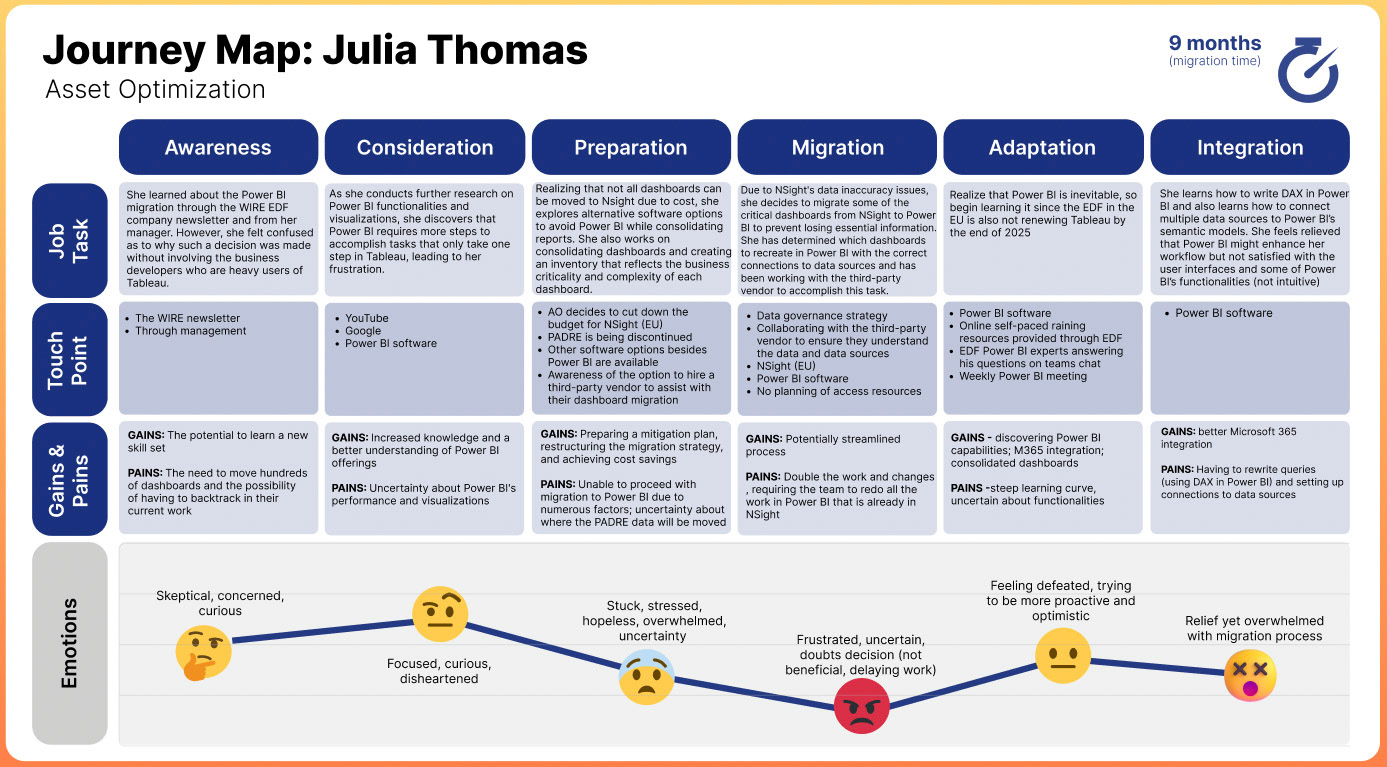
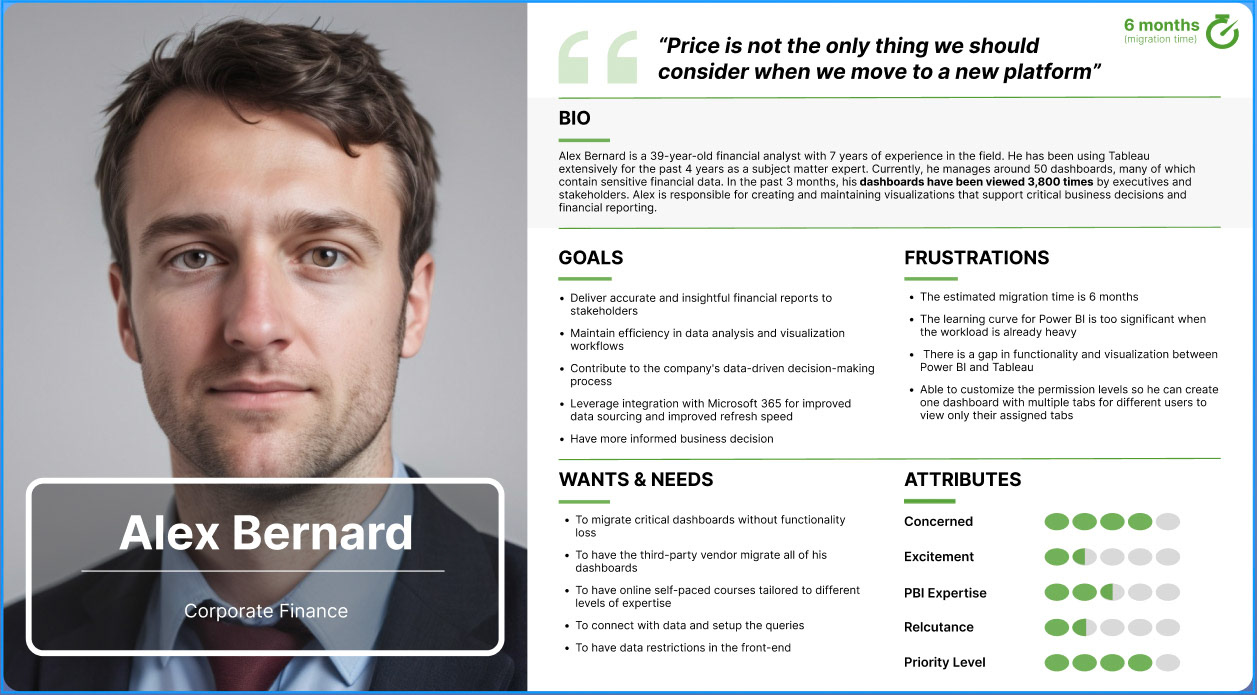
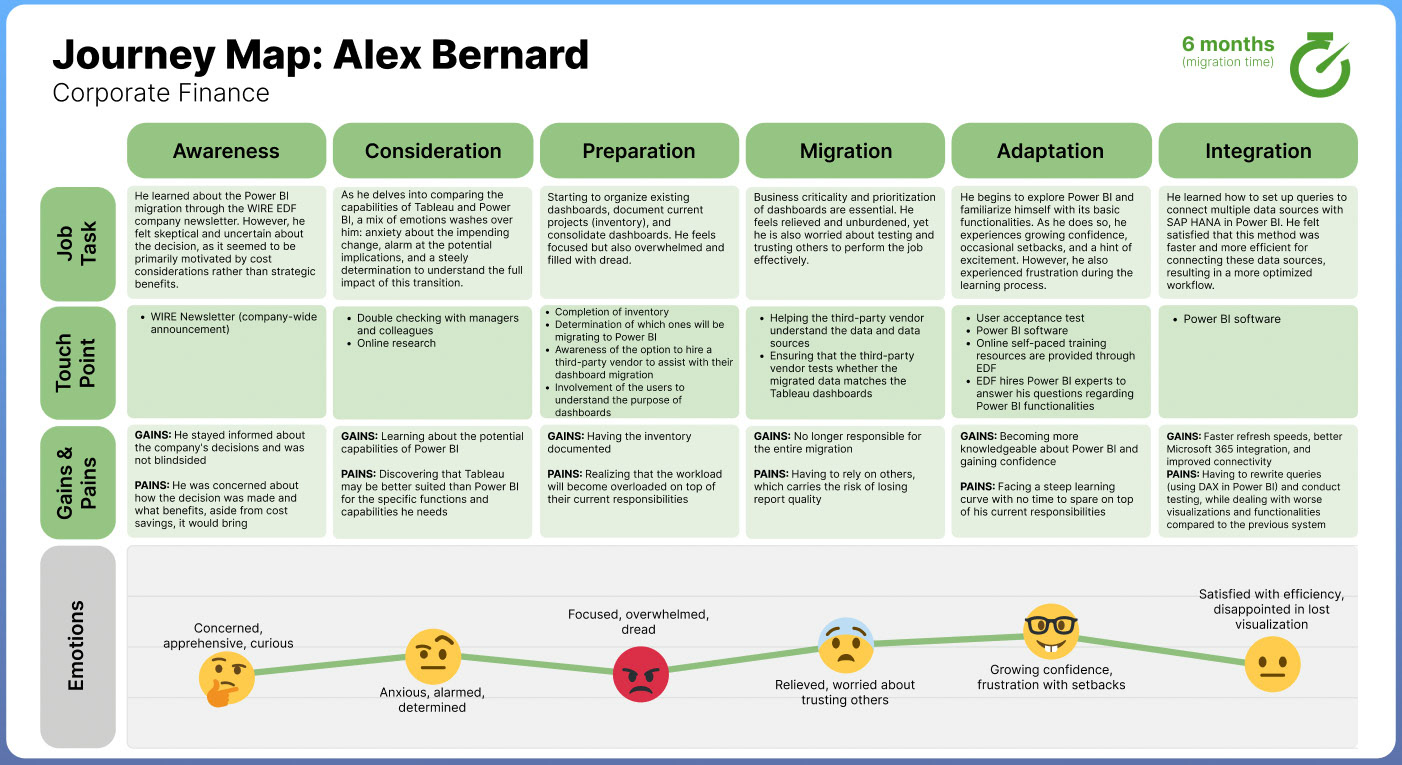
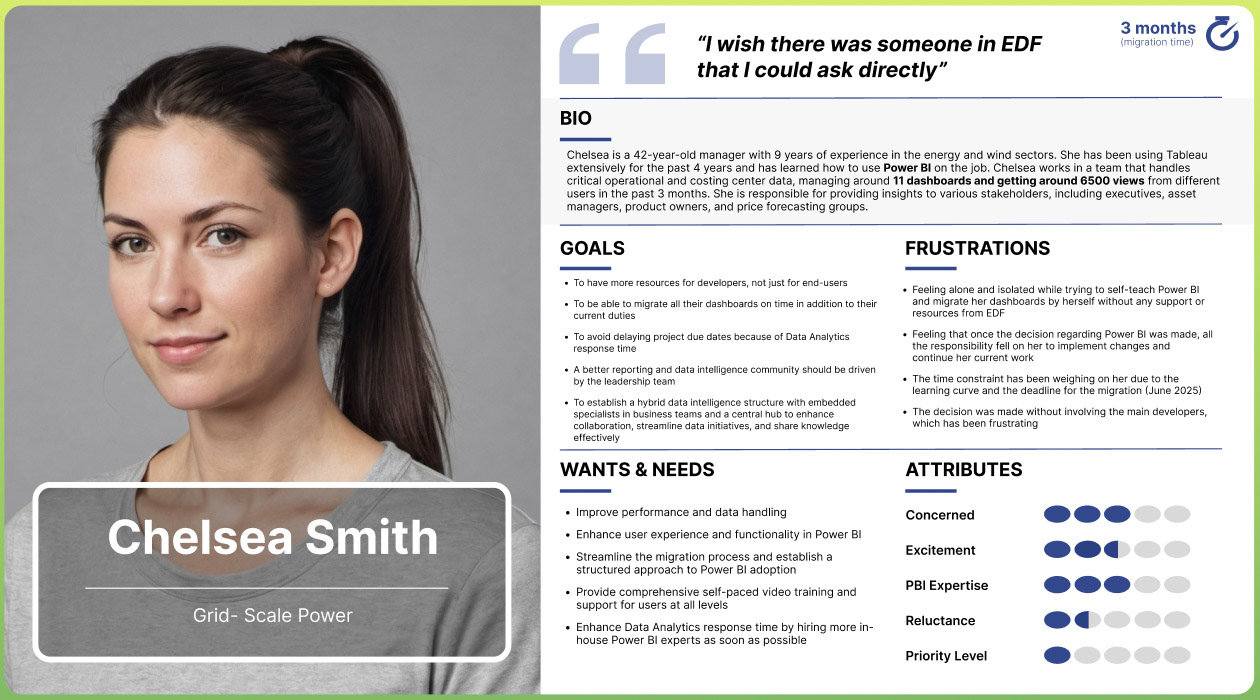
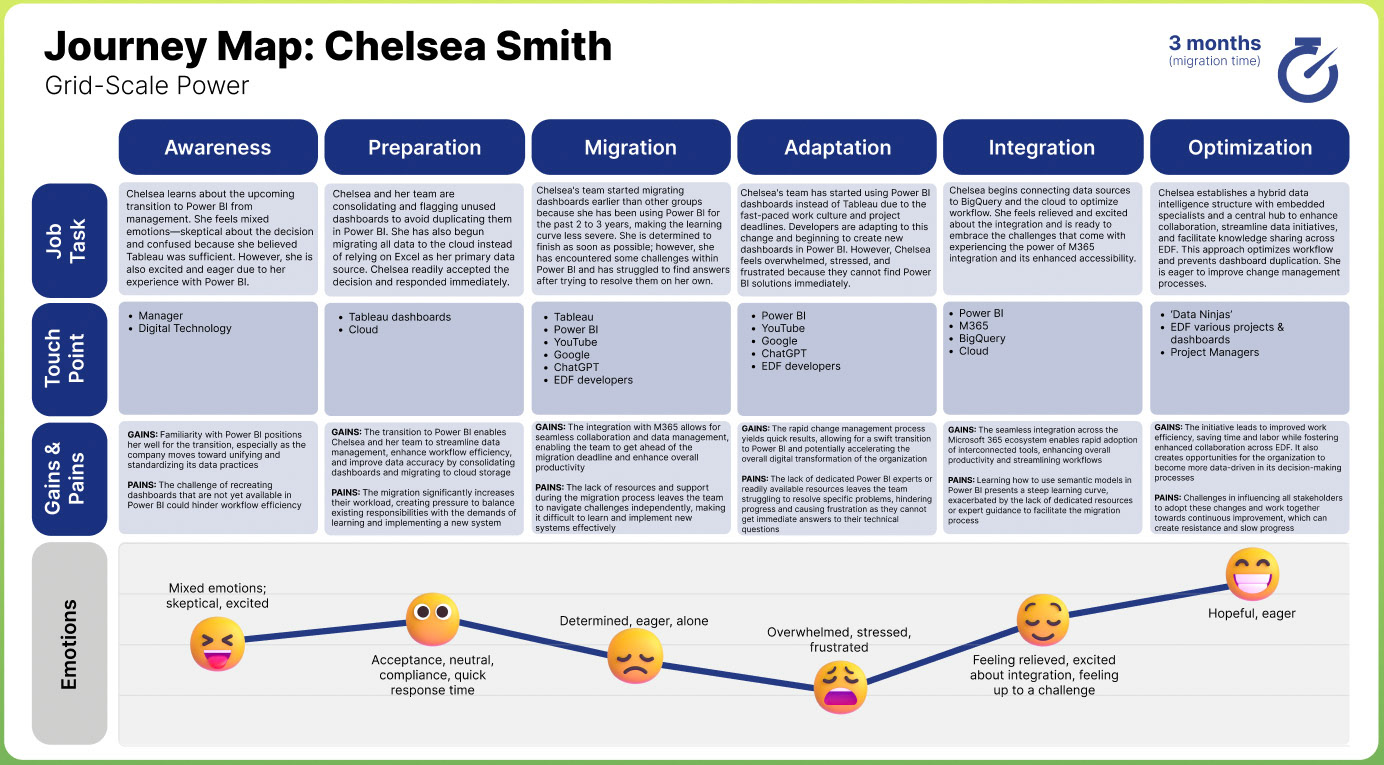
Leveraging insights gathered from my users, I developed three detailed user personas and corresponding journey maps. This approach allowed me to capture the diverse needs and experiences of our users, providing a clear framework for understanding their interactions and guiding future design decisions.


Miro: brainstorming session

1. Asset Optimization Dept.

2. Corporate Finance Dept.

3. Grid-Scale Power


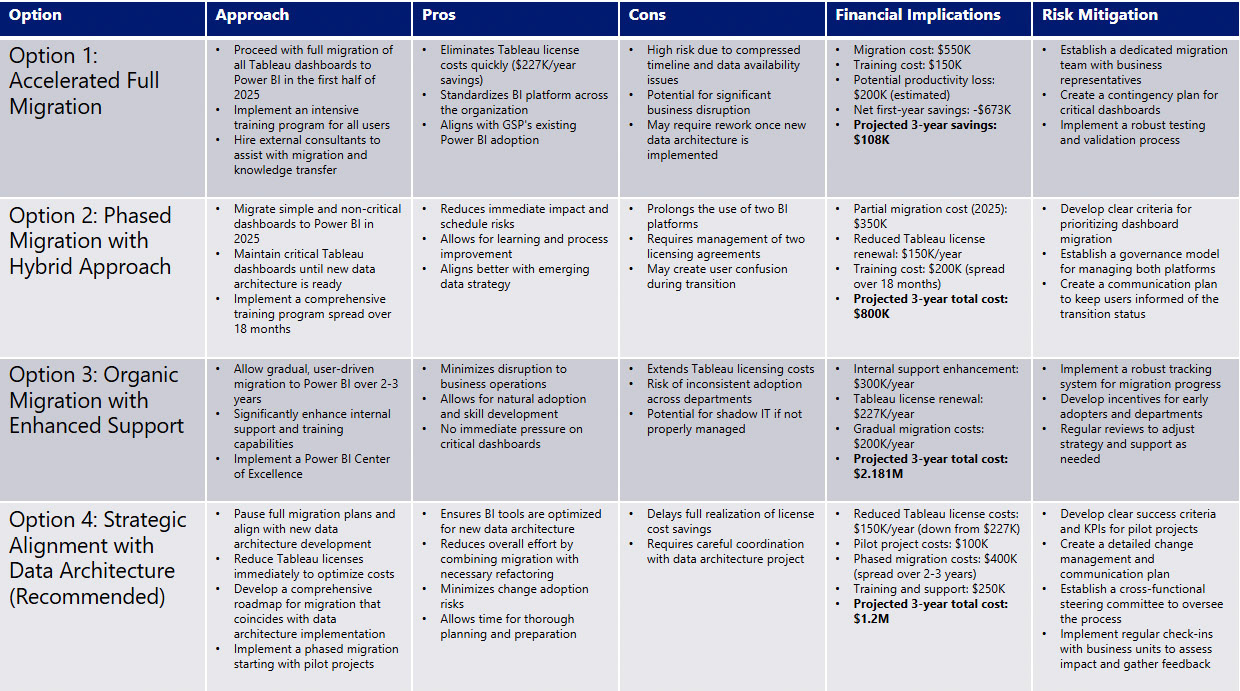
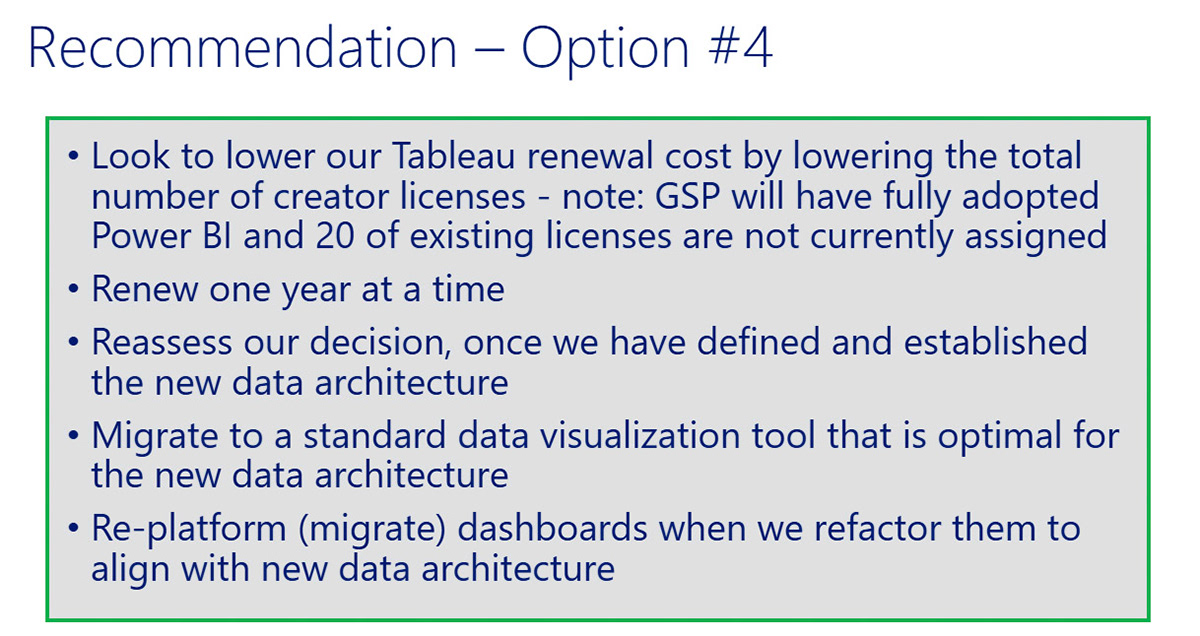
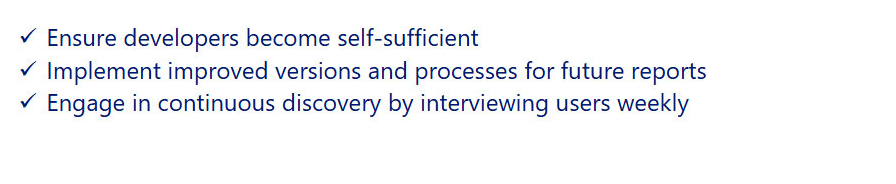
My strategic recommendation was to postpone the migration timeline while maintaining a clear focus on the goal of fostering ongoing user engagement throughout the transition process

Strategic Recommendations

Additional Recommendations

Back to Top